
2020 Census: Big cities grew and became more diverse, especially among their youth
In the remaining 17 of these 36 “minority white” cities, white residents represented the biggest racial group though still comprising less than half of the population. For example, in Chicago white residents comprise 31.4% of the population, higher than any other race or ethnic group, but only slightly higher than residents identifying as Latino or Hispanic (29.8%) or Black (28.7%) Likewise in other cities, including New York, Phoenix, San Francisco, and Boston, white residents comprise less than half of the population but a greater share than any other racial or ethnic group.
In most of these cities, the white share of the population has continued to decline—among 45 of the 50 cities between 2000 and 2010, and among 44 between 2010 and 2020 (download table B). For example, in the city of Las Vegas white residents comprised 58% of city residents in 2000. This fell to 48% in 2010 and to 40% in 2020. Other cities which showed similarly large declines in white population shares are Tulsa, Okla., Indianapolis, Columbus, Ohio, and Jacksonville, Fla. However, over this same period, a few big cities showed small increases in the white population shares, including Washington D.C., Atlanta, Oakland, Calif., and Denver.
’New minority’ gains vs. white and Black flight
The increased diversity shown for most big cities is the consequence of race-ethnic shifts heavily impacted by movement into and out of these cities of different groups as well as natural demographic growth (the increase of births over deaths).2Some of this involves the growth of what I have termed “new minorities”—Latinos or Hispanics, Asian Americans, and persons identifying with two or more racial groups”—whose growth rates nationally have dwarfed those of other groups in recent decades, due in part to the rise of immigration from Latin America and Asia.
Yet big city populations have also been affected by changes in other racial and ethnic groups, especially white and Black. There has been a longstanding “white flight” to suburbs since at least the 1950s in many American cities and more recently a “Black flight” trend that became most prominent in the 2010-2020 decade.
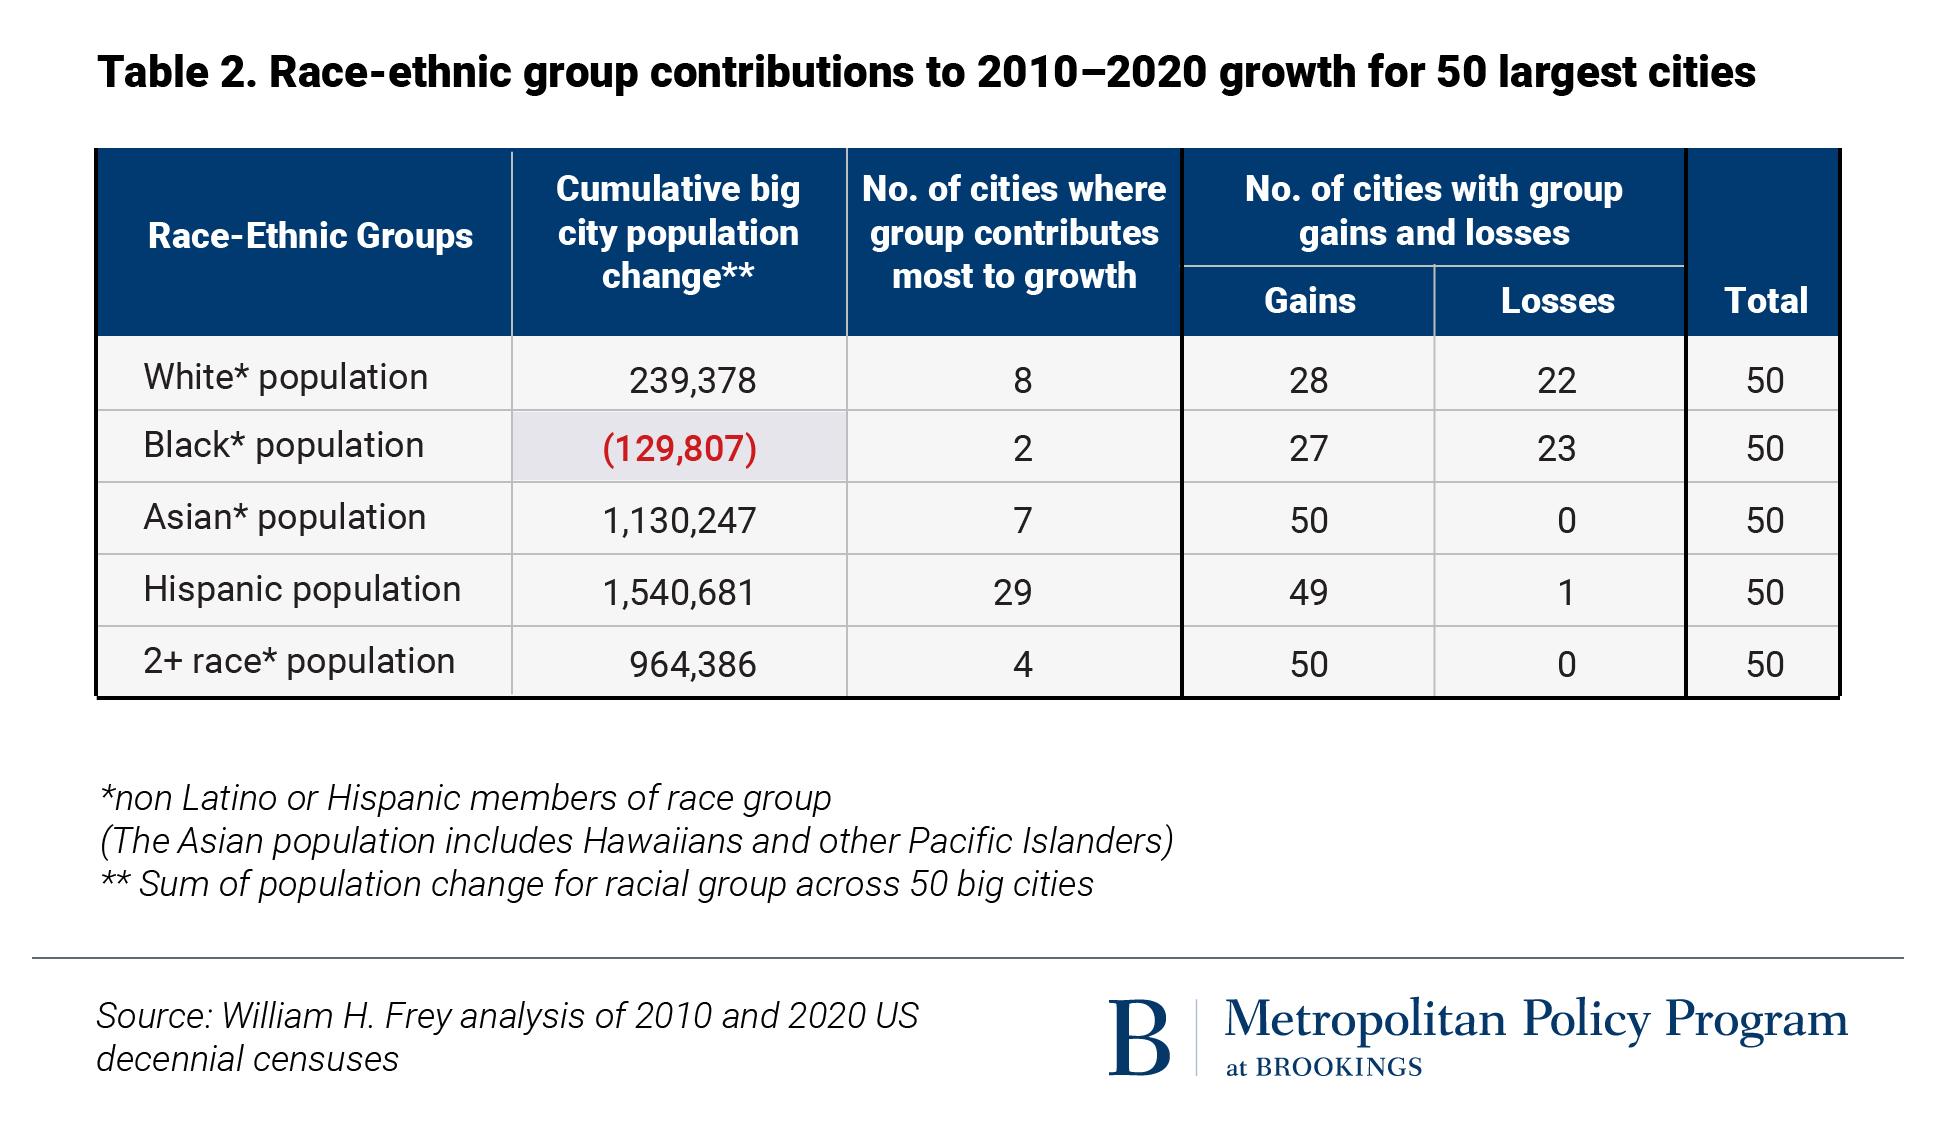
Recent changes in the race-ethnic makeup of America’s big cities have been impacted by each of these components but especially “new minorities.” Over the 2010-2020 decade, the aggregated 50 city populations gained 1.5 million from persons identifying as Latino or Hispanic, 1.1 million from Asian Americans, and nearly 1 million from those identifying as two or more races. This stands in contrast with a small overall gain in the aggregated white population and modest decline for Black residents.
These aggregate patterns reflect different gains for individual cities (download Table C). The biggest contribution to 2010-2020 gains in the vast majority of cities (29) came from the Latino or Hispanic population. This includes cities with long-standing Latino or Hispanic populations such as Houston, San Antonio, and Phoenix, as well as cities where the Latino or Hispanic population is not dominant (e.g. Philadelphia, Memphis, Tenn., Baltimore, Milwaukee) but increasingly dependent on Latino or Hispanic populations for growth or stasis.
In seven cities, New York, Chicago, San Jose, Seattle, San Francisco, San Diego, and Boston, Asian American residents contributed the most of all race-ethnic groups to 2010-2020 gains. And in four, most notably Los Angeles, the two-or-more-race population was the biggest contributor.
Unlike the above-mentioned groups, which contributed to at least some growth in most big cities, contributions of white and Black residents were more uneven. White populations gained in only 28 of the 50 cities and contributed more than any other group in just eight: Denver, Washington, D.C., Austin, Texas, Atlanta, Raleigh, N.C., Omaha, Neb., and Minneapolis. And while the Black population grew in 27 cities, it was the biggest contributor in just two, Columbus, Ohio an Arlington, Texas. In the rest, including those with substantial Black populations, other racial and ethnic groups made bigger contributions.

The new census numbers reveal modest changes in the long-standing “white flight” and more recent “Black flight” phenomena. While 22 cities showed white population losses in 2010-2020, this is fewer than those in the previous two decades (34 cities in 2000-2010 and 30 in 1990-2000). And overall, fewer cities showed large white losses than in earlier decades (download Table D). For example, in the 1990s, six cities lost more than 100,000 white residents, led by New York (-361,000) and Los Angeles (-200,000). In contrast, the cities that lost the most whites in 2010-2020 were Indianapolis (-36,000) and San Jose (-35,000).
As discussed earlier, Black city population losses were more widespread in the 2000-2010 decade than in the 1990s—as the number of Black-loss cities rose from 13 to 20 and added up to an overall 50-city Black population loss. While 23 cities lost Black populations in the most recent decade, the magnitude of this loss declined for the 50 cities as well as several individual cities (download Table D). For example, in the cities with the largest Black losses in 2010-2020, Detroit, Chicago, New York, Los Angeles, Washington, D.C., and Oakland, Calif. lost considerably fewer Black residents in 2010-2020. Still a few more cities have joined the “Black flight” list.
Child populations are the most diverse
The 2020 census results made clear that racial and ethnic diversity is more pronounced for the nation’s youth than the adult population. For the first time, more than half of the child (under age 18) population identifies with a nonwhite group.
Most big cities have already achieved youthful diversity, but this has become more pronounced with the new census numbers. As a group, the youth population of the aggregated 50 cities were already decidedly “minority white” in 2000 with just 29% identifying as white alone. This became reduced to 25% in 2020 such that the combined Latino or Hispanic, Asian American and two or more race population rose to more than half of the youth population. Although the adult population of these cities also became diverse it is important to understand the sharp diversity differences between adults and children, as observed in selected large cities shown in Figure 3.


When looking at the individual cities, only two of the 50, Colorado Springs, Colo. and Portland, Ore., had white majority youth populations in 2020, down from 7 in 2010 and 13 in 2000 (download Table E). Cities with white shares of their youth population below 15% were Detroit, El Paso, Texas, Memphis, Tenn., Milwaukee, Long Beach, Calif., Fresno, Calif., Miami, San Antonio, and Houston. Latinos or Hispanics represented the largest youth race or ethnic group in 25 cities, including Los Angeles, Chicago, New York, and Boston. Black youth were the most populous youth race or ethnic group in 10 cities, including Atlanta, Baltimore, and Philadelphia; and in one city, San Francisco, Asian Americans are the largest of all racial and ethnic groups among youth.
Link nội dung: https://phamkha.edu.vn/in-many-big-cities-a36134.html